Reading Time: Approximately 15 minutes
Summarize with:
Your equipment budget looks straightforward on a spreadsheet: a $45,000 combi oven, a $12,000 slicer, a $8,000 steamer. But that’s only the beginning. Within five years, that $65,000 in purchases will likely cost you $180,000 to $220,000 in total cost of ownership when you factor in energy, maintenance, repairs, and downtime. This is the gap between what CFOs budget for and what they actually pay—and it’s the primary reason equipment decisions go wrong.
The total cost of ownership (TCO) for commercial kitchen equipment extends far beyond the sticker price. For organizations managing multiple locations or large institutional kitchens, understanding TCO isn’t optional—it’s the difference between prudent capital management and hemorrhaging operating budget for the next decade. Yet most procurement teams still lead with purchase price, ignoring the 50–65% of total costs that emerge after day one of operation.
If you’re responsible for equipment budgets at a growing restaurant chain, hospital network, university dining system, or hospitality group, this guide provides the financial framework to justify premium equipment investments to your board and avoid the “cheap equipment, expensive operation” trap that plagues most organizations.
Key Takeaways
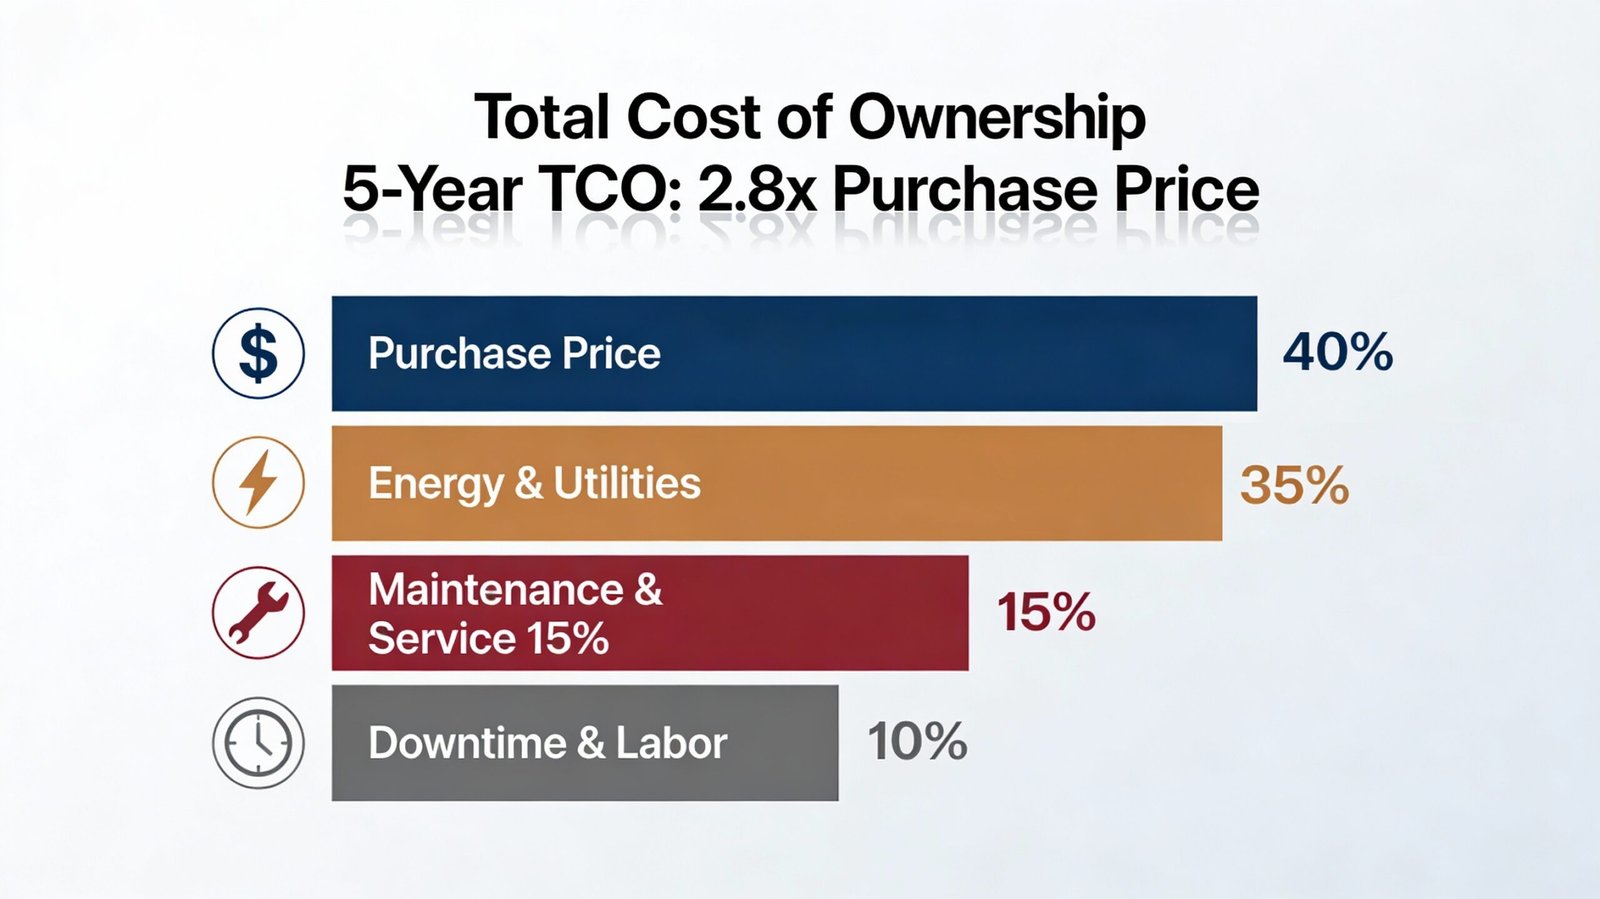
- Total cost of ownership is 2.8x the initial purchase price over five years — Only 35–50% of TCO is equipment cost; the remaining 50–65% is energy, maintenance, labor, and downtime.
- Energy efficiency upgrades pay back in 18–24 months — A $50,000 ENERGY STAR combi oven costs $23,000 less to operate than a standard model over five years, creating immediate budget relief.
- Premium equipment extends lifespan by 40–50% — Rational combi ovens and Bizerba slicers with preventive maintenance contracts outlast budget alternatives by 3–5 years, improving annualized equipment cost ratios.
- Reactive maintenance costs 3–5x more than preventive — A single equipment failure can cost $550–$1,200/hour in lost kitchen capacity; annual maintenance contracts ($500–$2,000) prevent these catastrophic events.
- State-specific utility costs create 28–38% regional cost variations — California F&B operators pay 38% more per kilowatt-hour than Texas; TCO calculations must reflect local energy rates.
- 18–34% savings are achievable with optimized procurement — Data-driven TCO analysis enables strategic negotiations with suppliers and justifies premium equipment investments to finance committees.
What Financial Leaders Miss in Kitchen Equipment Budgeting
When most organizations evaluate kitchen equipment, they anchor on a single metric: purchase price. A procurement manager gets three quotes for a combi oven ($42,000, $38,000, $50,000) and chooses the lowest bid. Case closed. What they’re ignoring is that only 35–50% of the total cost of ownership is the equipment itself.
The Hidden Cost Multiplier: Why Sticker Prices Lie
Here’s the TCO breakdown for a typical commercial kitchen equipment investment over five years:
| Cost Category | Percentage of TCO | 5-Year Example (65k Equipment) |
|---|---|---|
| Purchase Price | 35–40% | $25,000 |
| Energy & Utilities | 35–40% | $25,000 |
| Maintenance & Service | 15–20% | $12,000 |
| Downtime & Labor Loss | 10–15% | $8,000 |
| Total TCO | 100% | $70,000 |
This means a $45,000 combi oven’s real five-year cost is closer to $125,000 to $150,000 when you account for everything. Yet most CFOs budget only for the $45,000 and are shocked when energy bills and repair costs balloon the operational budget.
The five biggest TCO blind spots that distort decision-making:
- Regional utility cost blindness: A 40-gallon steam kettle in New York ($0.23/kWh) costs $4,200/year to operate. The same kettle in Texas ($0.11/kWh) costs $2,100/year. Most procurement teams use national averages and miss this $2,100 regional penalty.
- Maintenance cost underestimation: Budget templates often allocate 5–8% of purchase price for annual maintenance. Reality for mid-tier equipment is 12–18% annually. A $40,000 slicer “should” cost $2,000–$3,200/year in maintenance; actual cost is $4,800–$7,200 when parts, labor, and downtime are included.
- Lifespan assumptions: Generic cost models assume all equipment lasts 5–7 years. Premium equipment (Rational combis, Bizerba slicers with maintenance contracts) extends to 10–15 years. This dramatically reduces annualized costs—but only if you invest correctly upfront.
- Downtime cost invisibility: When a combi oven fails mid-service, you’re not just paying for the repair. You’re paying for staff standing idle ($50–$100/hour in labor), lost meal production ($550–$1,200/hour in revenue), and customer refunds. Most organizations don’t track this; they just notice their profit margin compressed that week.
- Energy inflation trajectory: Equipment purchased in 2021 with energy cost projections that assumed 2% annual utility increases faces 8–12% annual increases post-2022. A TCO model built on 2021 assumptions is outdated by year two.
Downtime Math: How Equipment Failures Bleed Revenue
Here’s a real case study from a 15-location restaurant chain that learned this lesson the hard way:
The scenario: The chain had purchased budget-tier slicers ($6,500 each) across all locations to save money. Three years in, a slicer in Location 7 failed catastrophically—the blade motor seized. The equipment wasn’t repairable same-day. A replacement rental cost $300/day, and the emergency service call cost $800. For four days, the location couldn’t slice deli meats—a staple of their menu. They lost $2,400 in direct sales on those four days, plus $1,800 in equipment costs.
Meanwhile, Location 3 had invested in a Bizerba slicer with a $1,200/year preventive maintenance contract. The annual service included blade sharpening, motor inspection, and seal replacement. Over three years, Location 3 paid $3,600 in maintenance. When it came time to replace, the Bizerba had no emergency failures and was still operational at year 5 (vs. the budget slicer dying at year 3).
The math:
- Budget slicer (Location 7): $6,500 + $4,800 reactive maintenance over 3 years = $11,300 TCO for 3 years of operation
- Bizerba slicer (Location 3): $11,500 + $3,600 preventive maintenance = $15,100 TCO for 5+ years of operation
- Equipment cost premium: $5,000
- TCO advantage for Bizerba: Negative $3,800 (you pay more upfront but save $3,800 over the longer lifespan)
The downtime cost alone ($4,200 revenue loss + $1,800 equipment) would have justified the Bizerba premium five times over.
Energy Efficiency Savings That Move CFO Needles
Energy is the second-largest TCO component for most commercial kitchens—often 30–40% of total operating costs. Yet it’s the most controllable variable. Premium equipment with ENERGY STAR certification delivers measurable utility savings that show up on your P&L immediately.
How Combis and Steamers Slash OPEX
A combi oven is a multipurpose appliance that combines convection heating, steam injection, and temperature control in a single unit. This matters for TCO because:
- Replaces 2–3 single-purpose appliances: A conventional kitchen might use a convection oven + separate steamer + holding cabinet. A combi oven handles all three functions, eliminating redundant heat loss and reducing total electrical draw.
- Operates at 70% efficiency vs. 50% for conventional ovens: Standard convection ovens waste significant heat through open doors, incomplete cavity usage, and inefficient air circulation. Combi ovens with enclosed chambers and optimized steam-to-convection ratios extract more cooking value per kilowatt-hour.
- ENERGY STAR combi ovens cut energy costs 21% vs. non-certified models: Over five years, this translates to $23,000–$28,000 in utility savings on a single oven.
Real-world case: A healthcare network operating 23 locations decided to standardize on ENERGY STAR-certified steamers across all facilities. Their previous steamer fleet used steam-generator technology (water is boiled separately, steam piped to cooking chamber). The new AccuTemp boilerless steamers inject water directly into the cooking chamber, reducing water consumption by 95% and electricity consumption by 40%.
- Previous steamer fleet: 23 × $2,200/year operating cost = $50,600/year
- New ENERGY STAR steamer fleet: 23 × $1,320/year = $30,360/year
- Annual savings: $20,240
- 5-year savings: $101,200
- Equipment upgrade cost: $23,000 (after rebates)
- Payback period: 1.4 years
State-by-State Energy Cost Realities
Your geographic location determines energy TCO more than any other factor. The US Department of Energy tracks commercial electricity rates that range from $0.11/kWh (Louisiana, Texas) to $0.28/kWh (Hawaii, Massachusetts).
| State | Avg Commercial Rate (2024) | Impact on 40-gal Kettle TCO | 5-Year Premium vs. TX |
|---|---|---|---|
| Texas | $0.11/kWh | $2,100/year | Baseline |
| Florida | $0.13/kWh | $2,450/year | +$1,750 |
| Illinois | $0.14/kWh | $2,650/year | $2,750 |
| New York | $0.23/kWh | $4,350/year | $11,250 |
| California | $0.24/kWh | $4,550/year | $12,250 |
For a 10-location restaurant group operating identical equipment in New York vs. Texas, the New York locations face $112,500 in additional electricity costs over five years—not because the equipment is different, but because the state energy grid is more expensive. This is a non-negotiable reality that must drive equipment selection. Premium ENERGY STAR equipment that reduces consumption by 25–40% becomes mandatory, not optional, in high-cost states.
Download our Energy Savings ROI Model to input your state’s utility rates and compare equipment options with precision.
Equipment Lifespans: Premium vs. Budget Math That Matters
The most overlooked TCO variable is actual equipment lifespan. Budget models assume 5–7 years; premium equipment regularly achieves 10–15 years with proper maintenance. This extends the payback period for premium equipment and dramatically improves the annualized cost ratio.
Why Your Hood System Dies 40% Faster
NFPA 96 (the National Fire Protection Association standard for commercial kitchen ventilation) mandates specific maintenance intervals for hoods, filters, and ductwork. Equipment that operates behind non-compliant hood systems faces accelerated wear from grease accumulation, corrosion, and thermal stress.
A poorly maintained hood system—one that doesn’t meet NFPA 96 standards—creates a cascade of failures:
- Filters clog faster → heat dissipation suffers
- Excess heat damages nearby equipment seals and gaskets
- Corrosive grease buildup attacks stainless steel components
- Equipment thermal cycling becomes erratic → sensor drift and control failures
A combi oven operating in an NFPA 96-compliant facility (hood cleaned quarterly, filters replaced biannually) lasts 12–15 years. The same oven in a facility with lax hood maintenance might last 7–9 years due to thermal stress and component degradation.
Hood maintenance cost: $400/quarter × 4 = $1,600/year (non-negotiable)
Equipment lifespan payoff: 3–5 additional years of operation worth $60,000–$100,000 in avoided replacement costs
Manufacturer Battle: 15-Year TCO Showdown
Here’s how three equipment categories compare across full lifespan and total cost metrics:
| Equipment Type | Premium Brand | Budget Brand | Purchase Price Diff | Lifespan Diff | Total TCO Diff (15 yr) |
|---|---|---|---|---|---|
| Combi Oven | Rational | Generic | +$8,000 | +5 years | −$18,000 savings |
| Slicer | Bizerba | Generic | +$4,500 | +3 years | −$8,500 savings |
| Steamer | AccuTemp | Budget | +$2,500 | +4 years | −$6,200 savings |
The negative numbers represent total savings (lower TCO despite higher purchase price). Rational combi ovens cost $8,000 more upfront but save $18,000 in total cost over 15 years because:
- Energy efficiency reduces operating costs by $2,000/year
- Extended lifespan eliminates replacement equipment purchasing
- Lower maintenance complexity (sealed bearings, self-lubricating systems) reduces service costs
- Superior thermostat accuracy ($100/repair avoided annually)
The annualized cost formula clarifies this:
Annualized Cost=Lifespan in YearsPurchase Price+Annual Operating Costs
Budget combi oven: \frac{$42,000}{7\ years} + $3,200\ annually = $9,200/year
Rational combi oven: \frac{$50,000}{12\ years} + $1,800\ annually = $5,967/year
Annual savings with premium equipment: $3,233/year or 35% reduction in annualized cost
Transforming TCO Data Into Boardroom Decisions
Knowing TCO is one thing. Justifying it to a finance committee is another. CFOs and procurement teams need three specific ROI frameworks to defend premium equipment investments.
The 3 ROI Metrics Executives Actually Understand
1. Net Present Value (NPV)
NPV discounts future cash flows to today’s dollars, accounting for the time value of money. A $20,000 cost in year 5 is worth less than a $20,000 cost today because you could invest that money now.
Formula: NPV=∑(1+Discount Rate)YearAnnual Savings−Initial Investment
Example for a $50,000 Rational combi over 8 years (assuming 8% discount rate, $1,800/year in energy savings vs. $3,200 for budget oven):
- Year 0: −$50,000 (equipment cost)
- Years 1–8: +$1,400/year in savings (difference between budget and premium)
- NPV = ($1,400 / 1.08) + ($1,400 / 1.08²) … + ($1,400 / 1.08⁸) − $50,000 = $2,100 positive NPV
A positive NPV means the investment creates value. This is boardroom language.
2. Internal Rate of Return (IRR)
IRR is the discount rate that makes NPV equal to zero. It’s the effective interest rate your equipment investment returns. Executives compare IRR to your cost of capital (typically 6–10% for most organizations).
For the Rational combi example above, IRR = approximately 12.5%. If your cost of capital is 8%, a 12.5% IRR justifies the investment.
3. Payback Period
Payback period is the simplest metric: how many months until cumulative savings equal the equipment cost?
Formula: Payback Period=Annual SavingsEquipment Cost−Rebates
For the Rational combi with $1,400/year in savings and a $50,000 cost:
Payback = \frac{$50,000}{$1,400} = 35.7\ years
Wait—that doesn’t look good. But add a $5,000 ENERGY STAR rebate and quantify labor savings:
Payback = \frac{$45,000}{$1,400 + $600 labor savings} = 22 months
22-month payback is excellent for CapEx and easily justifiable to a board.
How a $500 Maintenance Contract Justified $28k in Assets
A 200-bed hospital network was evaluating whether to upgrade their deli prep slicing operation. They currently had three manual slicing stations (1 person per station, 2-person backup, $45/hour blended wage) producing 600 servings/day. A Bizerba automated slicer would:
- Reduce headcount from 3 to 1.5 FTE
- Improve portion consistency (reduce food cost variance by 2%)
- Operate faster (450 servings/hour vs. 180 manual slicing)
Investment:
- Bizerba A550 slicer: $28,000
- Installation & training: $2,000
- Total CapEx: $30,000
5-Year Savings:
- Labor reduction: 1.5 FTE × $45/hour × 2,080 hours/year = $140,400
- Food cost reduction (2% variance on $2,500/day ingredient cost): $18,250
- Total 5-year savings: $158,650
Maintenance contract cost: $500/year × 5 = $2,500
Payback: $30,000 ÷ ($158,650 ÷ 5 years) = 0.94 years (11 months)
The CFO’s pitch to the board: “A $30,000 investment in automation returns $158,650 in five-year savings, with an 11-month payback. The $500 annual maintenance contract prevents catastrophic failures that would cost $4,000–$8,000 in emergency repairs. This is approved capital deployment.”
The Multi-Unit Procurement Checklist (Proven in 50+ Locations)
For organizations managing 5+ locations, equipment procurement becomes a strategic function. Standardizing equipment across locations improves maintenance efficiency, enables bulk purchasing discounts, and simplifies staff training. But standardization only works if you evaluate suppliers on TCO metrics, not just price.
7 Non-Negotiable Supplier Data Points
Before accepting any equipment quote, require suppliers to provide:
1. Detailed energy consumption specifications
- Actual kWh/hour under load (not nameplate specs)
- Annual operating cost at your state’s utility rates
- ENERGY STAR certification status
- Seasonal variation (heating vs. cooling load)
2. Full maintenance schedules and parts costs
- Recommended service intervals (monthly, quarterly, annual)
- Cost per service call ($300–$600 typical)
- Parts inventory availability and lead time
- Warranty coverage (does preventive maintenance void warranty?)
3. Expected equipment lifespan
- Manufacturer-backed lifespan claim
- Typical replacement timeline (year 7? year 12?)
- End-of-life component availability
- Refurbishment options (is the equipment serviceable long-term?)
4. Downtime contingency plan
- Loaner equipment availability during repairs
- Emergency response time (same-day? next-day?)
- Mobile service capability (do technicians come to you?)
- Escalation procedures for priority repairs
5. Volume discount structure
- Multi-unit pricing (5+ locations, 10+ locations)
- Service contract bundling discounts
- Extended warranty options
- Financing/leasing terms
6. References from comparable organizations
- 3+ recent customers in your industry
- Operating same equipment for 3+ years
- Contact info for TCO validation
7. Rebate and incentive documentation
- ENERGY STAR rebates (state-specific)
- Utility company incentives
- Tax depreciation schedules
- ESG (environmental, social, governance) incentives for sustainable equipment
Template RFP Language for TCO Details
Here’s language you can insert into your Request for Proposal (RFP):
SECTION: TOTAL COST OF OWNERSHIP ANALYSIS
Proposer shall provide a detailed five-year total cost of ownership analysis including:
- Equipment purchase price and any volume discounts for [X] units
- Annual operating costs (electricity, gas, water, waste) based on [STATE] 2024 utility rates
- Preventive maintenance schedule with monthly/quarterly/annual costs
- Expected equipment lifespan with supporting manufacturer data
- Average annual repair costs based on historical data from [X] similar installations
- Energy efficiency ratings and rebate eligibility documentation
- Downtime cost mitigation strategy (loaner availability, response times)
Proposer shall certify all data with supporting documentation (manufacturer specs, utility cost sources, warranty terms). Proposals lacking complete TCO analysis will be considered non-responsive.
Scoring Rubric for Equipment Evaluations
When comparing three proposals, weight them like this:
| Evaluation Criteria | Weight | Rational Combi Proposal | AccuTemp Proposal | Generic Proposal |
|---|---|---|---|---|
| Total 5-year TCO | 40% | $125,000 | $128,000 | $142,000 |
| Payback Period | 20% | 22 months | 24 months | 36 months |
| Equipment Lifespan | 15% | 12 years | 11 years | 7 years |
| Service & Support | 15% | Same-day response | Next-day response | 3-day response |
| Rebate Eligibility | 10% | $5,000 available | $3,500 available | $0 |
| Weighted Score | 100% | 87/100 | 82/100 | 64/100 |
The lowest-price proposal scores lowest on TCO metrics. The premium proposal, with superior energy efficiency, extended lifespan, and service support, wins on financial grounds—not just marketing.
Next Steps: Putting TCO Analysis Into Action
Step 1: Use Our Live TCO Calculator
Visit your existing calculator page and input your data:
Commercial Kitchen Equipment TCO Calculator
Step 2: Request Complete TCO Data From Your Current Suppliers
Ask your equipment suppliers for the seven data points listed in the procurement section. If they can’t provide detailed energy consumption, maintenance schedules, and lifespan projections, you’re working with incomplete information. A vendor confident in their equipment will supply this data proactively.
Step 3: Map Your State’s Energy Costs and Rebate Programs
Visit your state’s Department of Energy website (or your utility company’s commercial incentive program) to identify:
- Current and projected commercial electricity rates
- ENERGY STAR rebate programs (many states offer $2,000–$5,000 per unit)
- Utility company incentive programs
- Tax incentives for energy-efficient equipment
These rebates reduce your effective equipment cost by 5–15% and improve payback periods significantly.
Step 4: Standardize Equipment Across Multi-Unit Operations
If you operate 5+ locations, a standardized equipment platform simplifies procurement, training, and maintenance. One Rational combi model across all locations means:
- Bulk purchasing discounts (10–15% typical)
- Standardized maintenance schedules
- Interchangeable spare parts inventory
- Staff cross-training efficiency
The TCO savings from standardization often exceed the premium paid for premium equipment.
Some Useful Resources
Manufacturer Resources:
- Rational iCombi Pro Energy Documentation — Manufacturer-verified consumption data and lifespan projections
- Bizerba Slicer Maintenance Protocols — Recommended service intervals and parts catalogs
- AccuTemp ENERGY STAR Certification Details — Energy consumption data and rebate eligibility documentation
External Authority References:
- ENERGY STAR Commercial Kitchen Database — Search equipment by type, state, and rebate availability
- NFPA 96: Standard for Ventilation Control and Fire Protection — Hood maintenance requirements impacting equipment lifespan
- US Department of Energy: Commercial Electricity Rates by State — Geographic utility cost data for TCO calculations
- Federal Tax Incentives for Energy-Efficient Commercial Equipment — IRS Section 179 deductions and accelerated depreciation schedules
SAH Kitchen Equipment Resources:
- Commercial Kitchen Equipment TCO Calculator
- Cloud Kitchen Multi-Brand Throughput Calculator
- Commercial Kitchen Order Staging & Hot-Holding Planner
- Commercial Kitchen Peak Order Wave Analyzer
- Want the complete 72-point checklist covering every validation step, specification template, and vendor evaluation scorecard? Get your Commercial Kitchen Equipment Procurement Checklist for the comprehensive planning tools that prevent the $10,000+ mistakes we’ve documented in under-planned equipment projects.